Dataset Overview
157
Car Models
16
Columns
30
Manufacturers
2
Vehicle Types
Data Quality
| Column | Missing Values |
|---|---|
Sales_in_thousands | 0 |
Price_in_thousands | 2 |
Engine_size | 1 |
Horsepower | 1 |
Fuel_efficiency | 3 |
Power_perf_factor | 2 |
__year_resale_value | 36 |
Note:
__year_resale_value has the most missing data (36 of 157 rows = 23%) — common in real-world resale datasets where not all models have recorded resale prices.
Top 10 Manufacturers by Total Sales
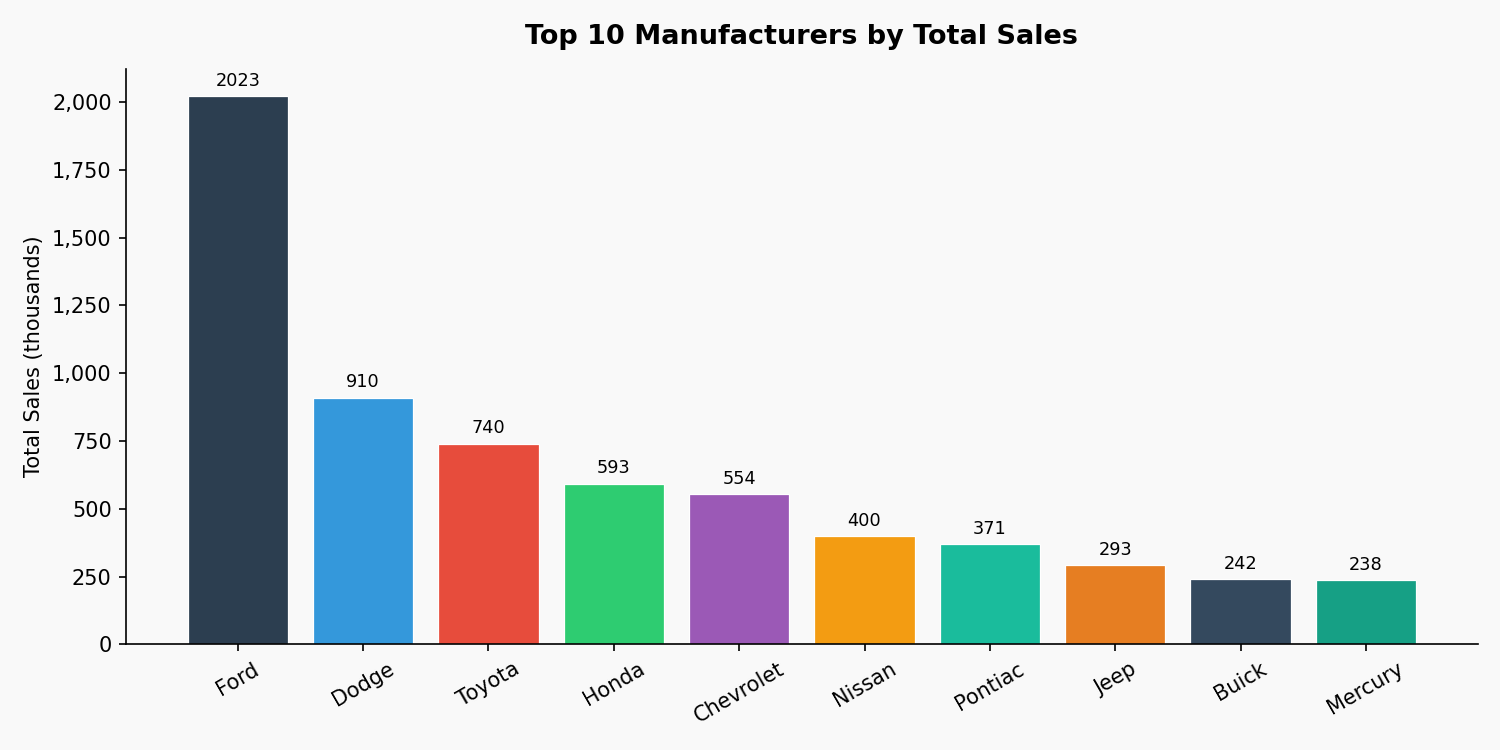
Total sales in thousands of units
| Rank | Manufacturer | Total Sales (thousands) |
|---|---|---|
| 1 | Ford | 2,022.63 |
| 2 | Dodge | 910.15 |
| 3 | Toyota | 740.21 |
| 4 | Honda | 592.67 |
| 5 | Chevrolet | 554.37 |
| 6 | Nissan | 399.63 |
| 7 | Pontiac | 370.53 |
| 8 | Jeep | 293.15 |
| 9 | Buick | 242.02 |
| 10 | Mercury | 238.00 |
Insight: Ford dominates with 2M+ units — more than double second-place Dodge. The top 3 manufacturers (Ford, Dodge, Toyota) account for roughly half of total market volume.
Price Distribution by Vehicle Type
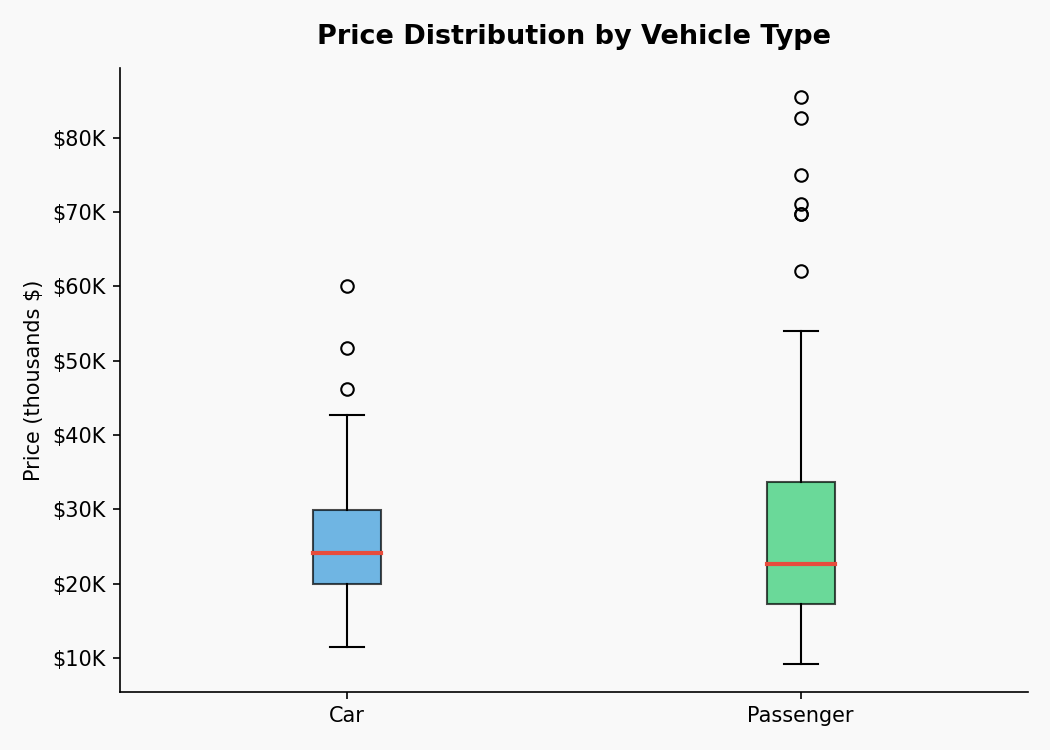
Boxplot showing price spread across vehicle categories
| Vehicle Type | Avg Price (thousands) |
|---|---|
| Car | $26.32K |
| Passenger | $27.76K |
Insight: Passenger vehicles carry a slight premium over Cars on average, but the spread within each category is wide — pricing strategy should account for model-level variance, not just type.
Horsepower vs Price
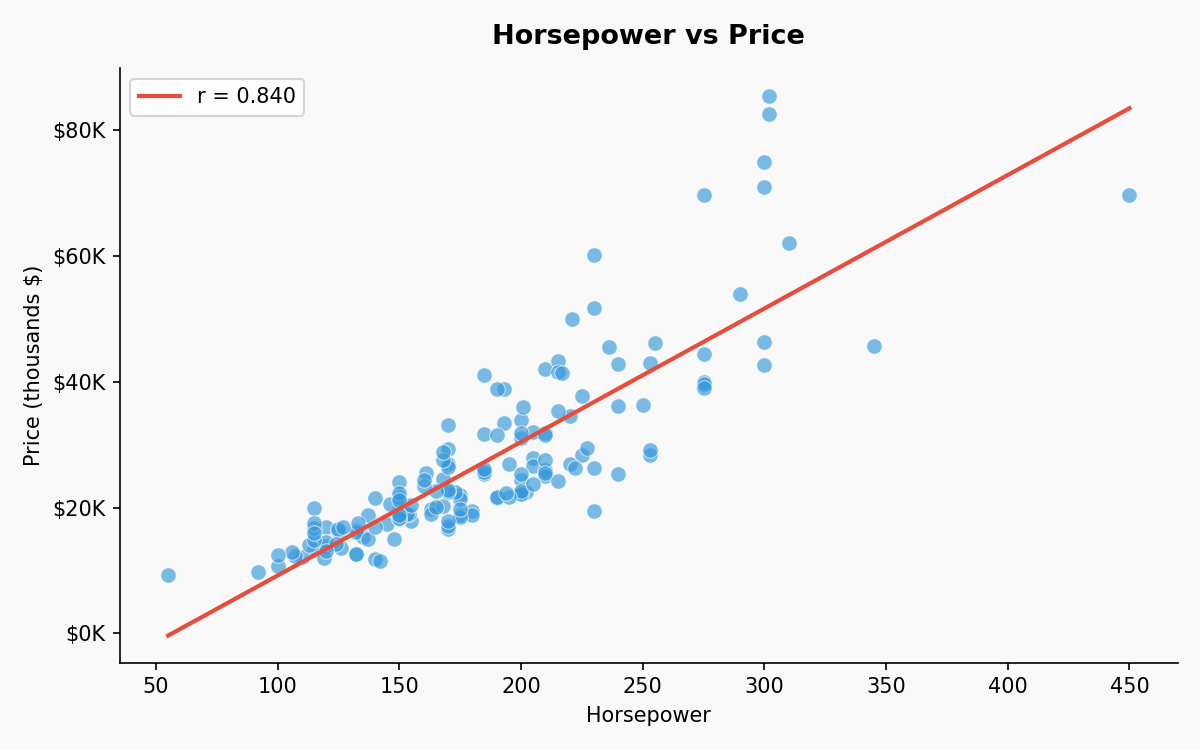
Each dot = one car model · Red line = linear trend
Sales Volume vs Price
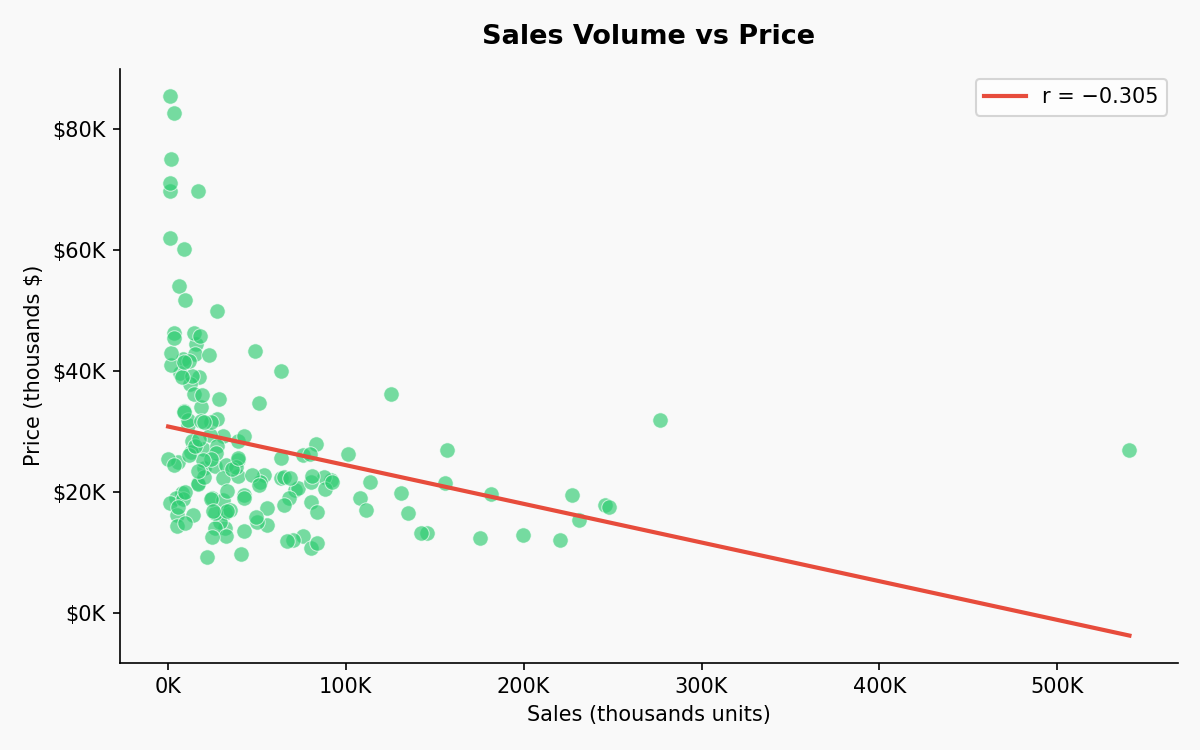
Each dot = one car model · Red line = linear trend
Correlation Results
r = 0.840
Horsepower ↔ Price
Strong positive — higher-performance cars are priced higher. n = 155
Strong positive — higher-performance cars are priced higher. n = 155
r = −0.305
Sales ↔ Price
Weak negative — lower-priced cars tend to sell more volume. n = 155
Weak negative — lower-priced cars tend to sell more volume. n = 155
Business Takeaways
- Benchmark top sellers: Focus marketing analysis on Ford, Dodge, and Toyota — their product mix and pricing are what mass-market volume looks like.
- Separate pricing strategy by type: Car vs Passenger avg prices differ; don't apply a single pricing rule across both.
- Volume vs premium trade-off: The negative sales-price correlation confirms the classic volume/margin trade-off — lower price drives more units, but HP-based pricing shows performance buyers will pay up.
Limitations & Next Steps
- Correlation ≠ causation — other variables drive both sales and price
- Only two vehicle types — results may not generalize beyond this dataset
- High missingness in
__year_resale_valuelimits retention analysis - Next: multivariate regression, outlier handling, time-based analysis if launch year data is used
How to Run
Original analysis (stdlib only — no dependencies)
python analysis.pyOutputs insights.md and top_manufacturers.csv.
Regenerate charts
pip install matplotlib
python make_charts.py
Saves all 4 charts to portfolio_report_assets/.
Tech Stack
Python 3
csv (stdlib)
math (stdlib)
Matplotlib