Dataset Overview
| Attribute | Detail |
|---|---|
| Models | 157 car models |
| Manufacturers | 30 brands |
| Variables | Price, 1-year resale value, sales volume, horsepower, fuel efficiency, engine size |
| Price range | $9.2K – $85.5K |
| Sales range | 100 – 540,600 units |
| Total market volume | ~8.3 million units |
Key metric — Retention Rate:
Retention Rate (%) = (1-Year Resale Value / Original Price) × 100
A 75% retention rate means a car loses 25% of its value in one year.
1. Value Retention by Manufacturer
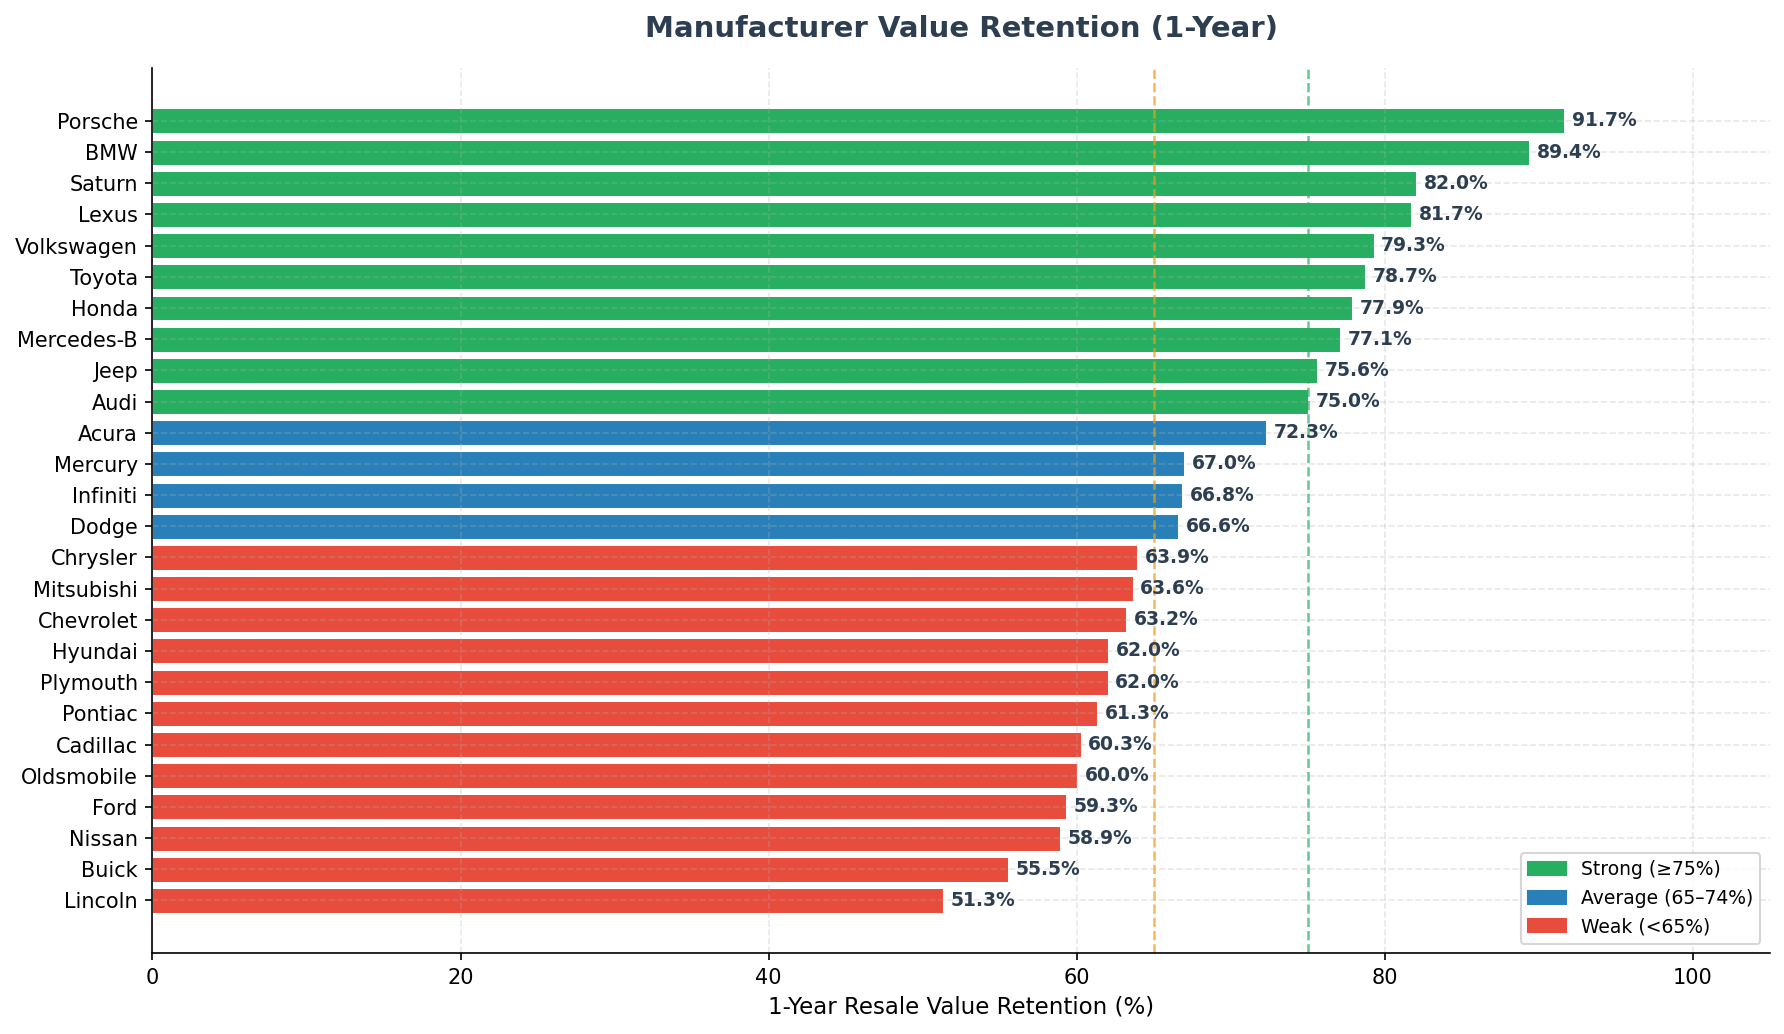
| Tier | Manufacturers | Avg Retention |
|---|---|---|
| Premium-hold | Porsche, BMW | ~90% |
| Reliable hold | Lexus, Toyota, Honda, VW | ~78–82% |
| Average | Jeep, Audi, Acura, Mercury | ~67–76% |
| High depreciation | Ford, Nissan, Buick, Lincoln | ~51–59% |
Insight: Price alone does not predict retention. Saturn (avg $12.5K) retains 82% — outperforming Cadillac ($38.8K, 60%). Brand loyalty and perceived reliability matter more than sticker price.
2. Price vs. Value Retention
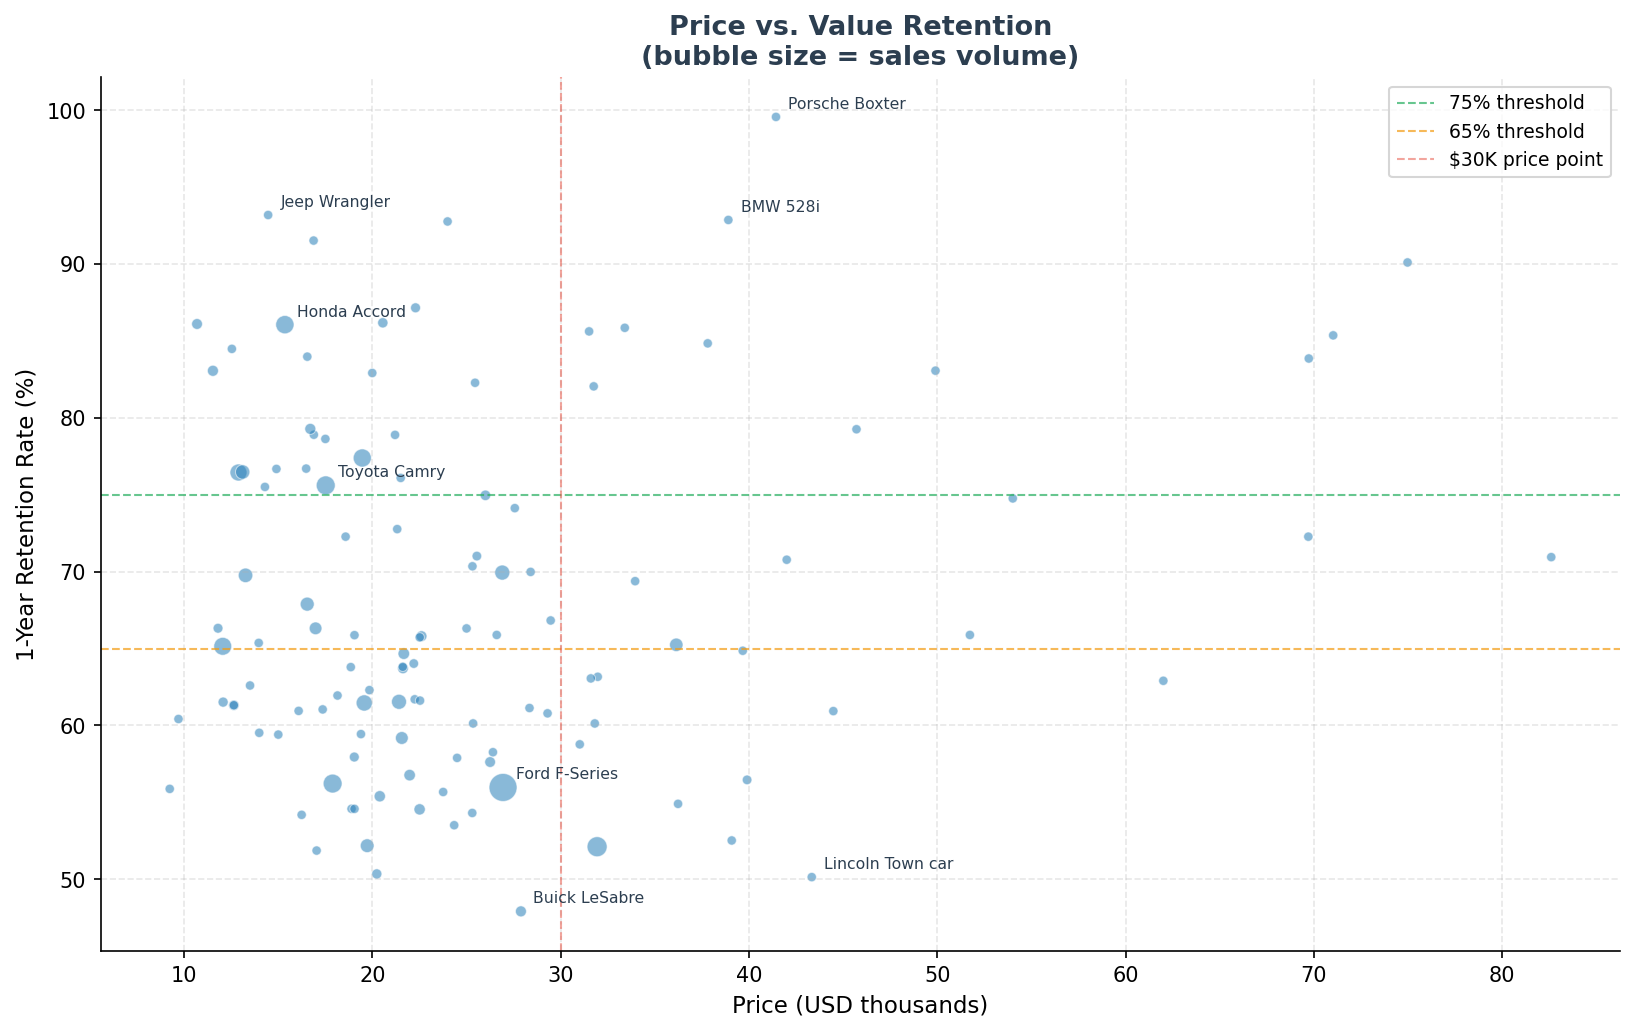
- No strong linear relationship between price and retention — expensive cars depreciate as fast as cheap ones if the brand lacks prestige or demand.
- Sweet spot models (high retention + high sales): Toyota Camry, Honda Accord, Honda CR-V — affordable, high-volume, strong resale.
- Luxury trap: Lincoln Continental ($39.1K, 52.5%) and Cadillac DeVille lose more in absolute dollars than economy cars.
3. Top & Bottom Models
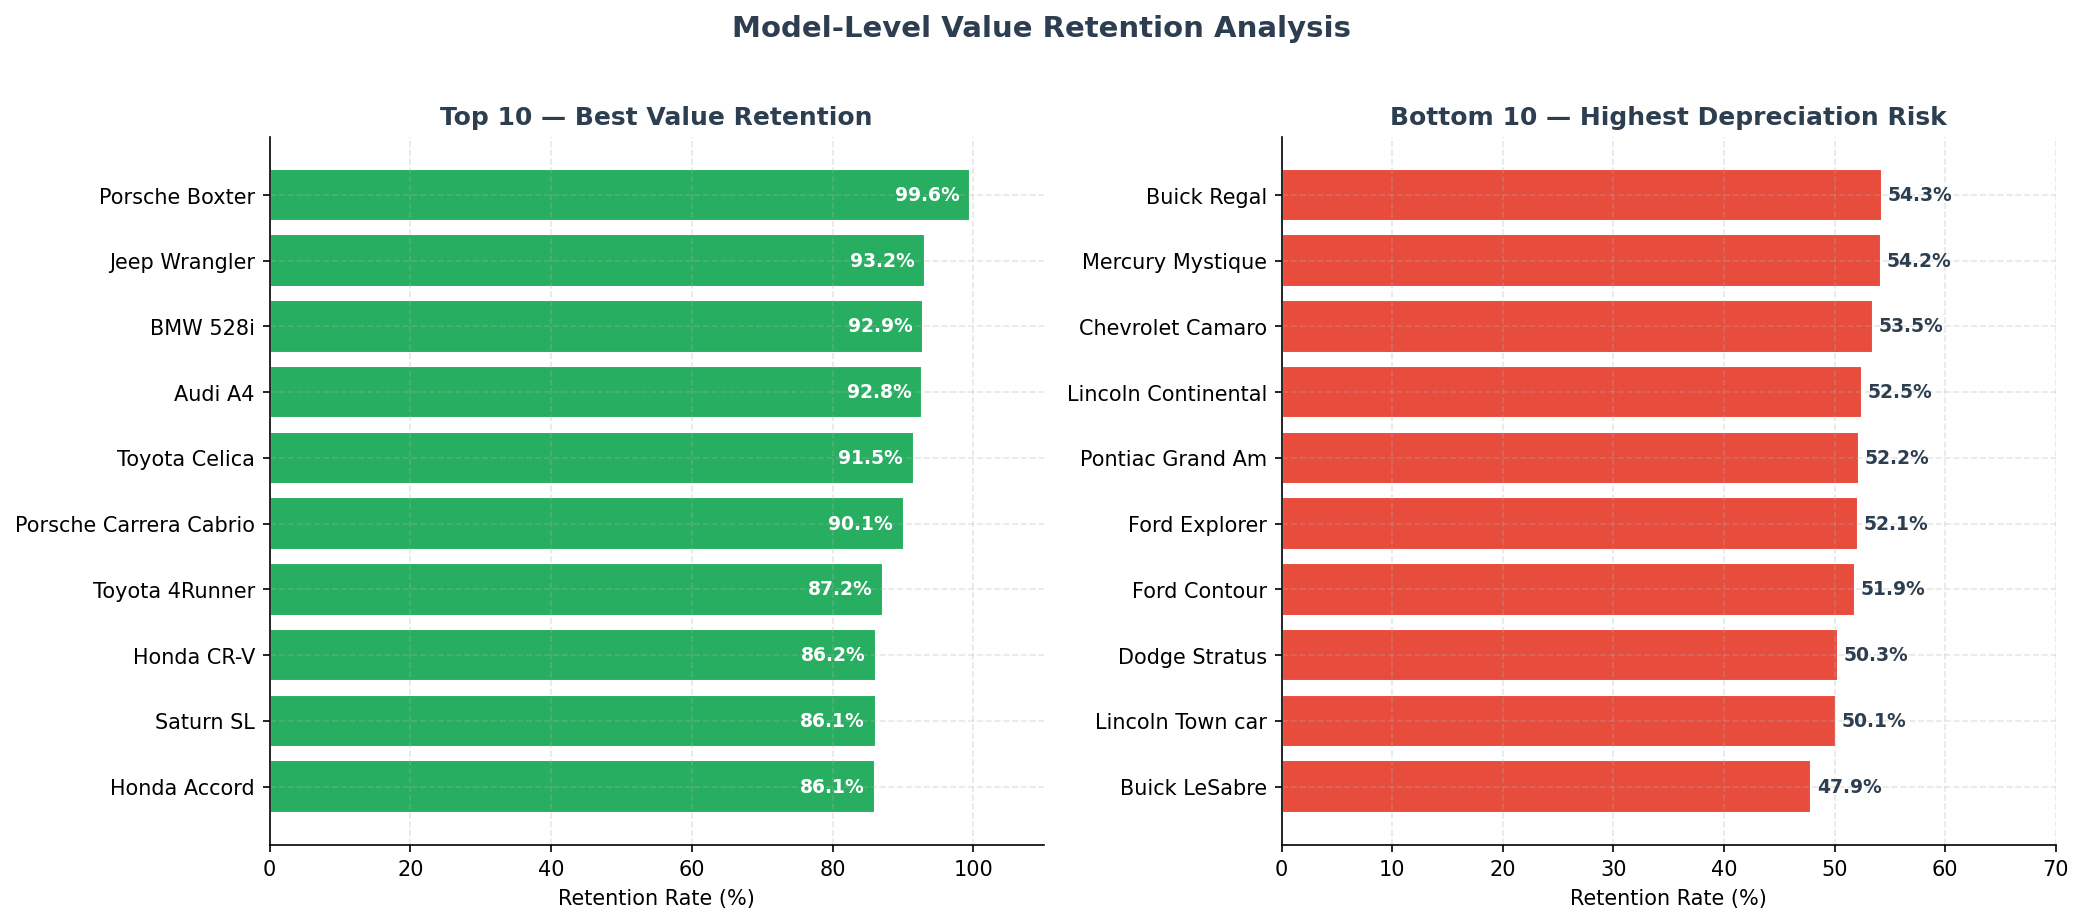
Top 10 by Retention
| Model | Price | Resale | Retention |
|---|---|---|---|
| Porsche Boxster | $41.4K | $41.2K | 99.6% |
| Jeep Wrangler | $14.5K | $13.5K | 93.2% |
| BMW 528i | $38.9K | $36.1K | 92.9% |
| Audi A4 | $24.0K | $22.3K | 92.8% |
| Toyota Celica | $16.9K | $15.4K | 91.5% |
| Porsche Carrera Cabrio | $75.0K | $67.5K | 90.1% |
| Toyota 4Runner | $22.3K | $19.4K | 87.2% |
| Honda CR-V | $20.6K | $17.7K | 86.2% |
| Saturn SL | $10.7K | $9.2K | 86.1% |
| Honda Accord | $15.3K | $13.2K | 86.1% |
Bottom 5 by Retention (Highest Depreciation Risk)
| Model | Price | Resale | Retention | 1-yr Loss |
|---|---|---|---|---|
| Buick LeSabre | $27.9K | $13.4K | 47.9% | -$14.5K |
| Lincoln Town Car | $43.3K | $21.7K | 50.1% | -$21.6K |
| Dodge Stratus | $20.2K | $10.2K | 50.3% | -$10.0K |
| Ford Contour | $17.0K | $8.8K | 51.9% | -$8.2K |
| Ford Explorer | $31.9K | $16.6K | 52.1% | -$15.3K |
Insight: The Lincoln Town Car loses $21,600 in one year — nearly the full price of a Honda Accord. For fleet buyers, this difference compounds dramatically across a vehicle fleet.
4. Market Positioning Map
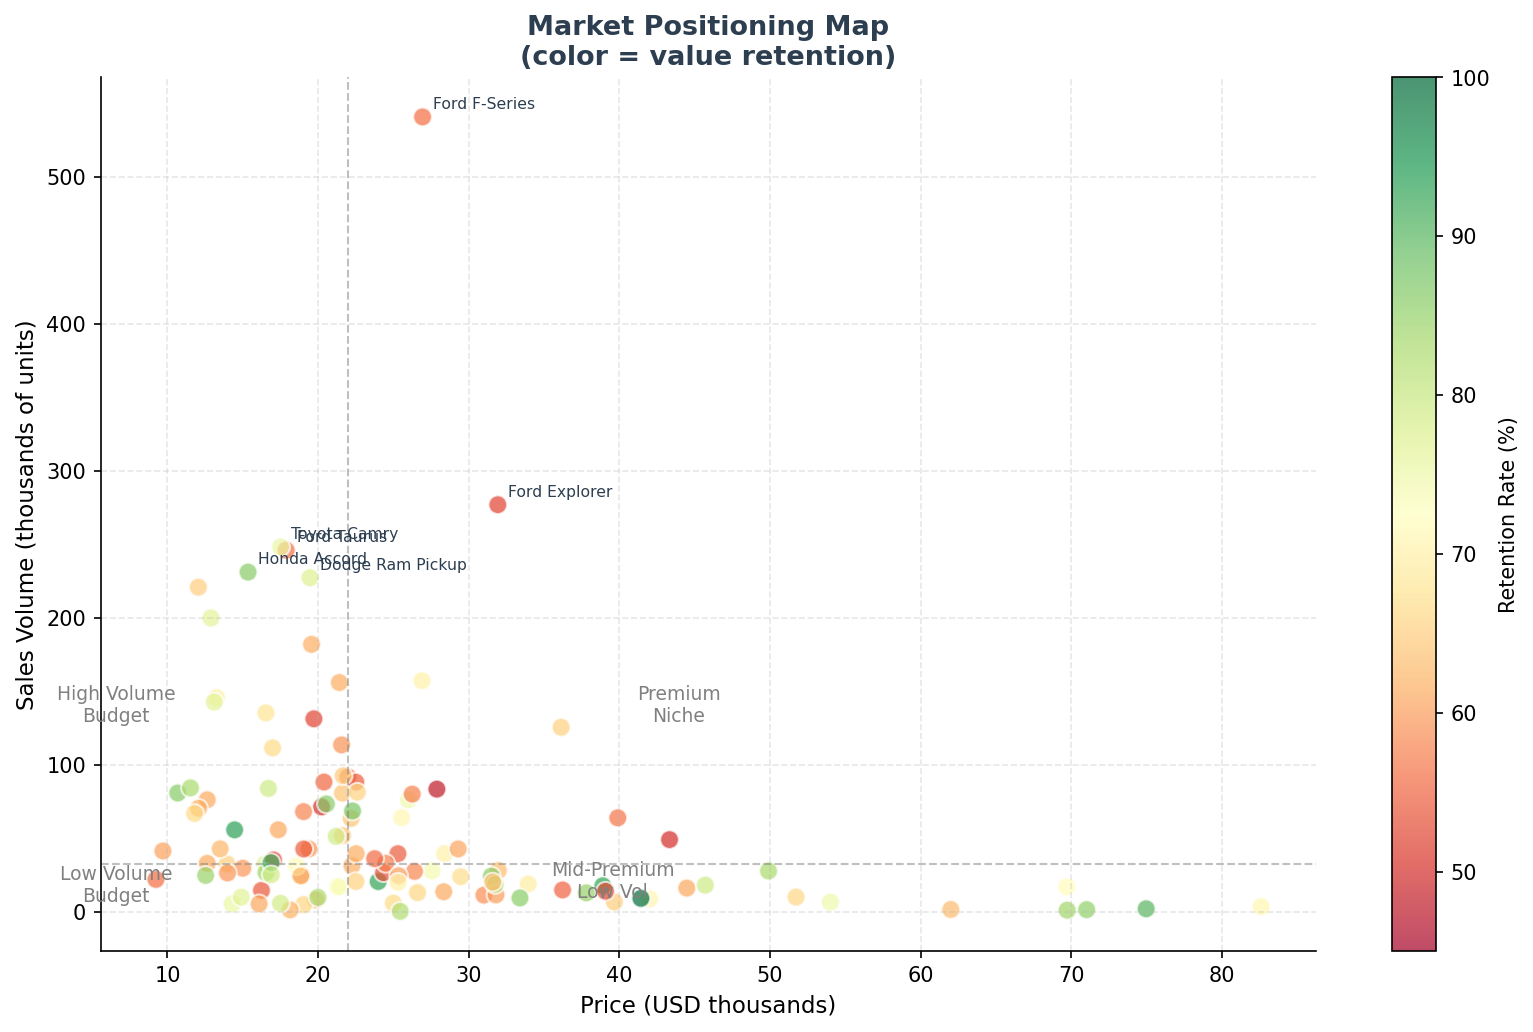
| Quadrant | Characteristics | Examples |
|---|---|---|
| High Volume / Budget | Mass-market, affordable, high retention | Honda Civic, Toyota Camry, Ford Focus |
| Premium Niche | High price, low volume, strong retention | Porsche, BMW, Lexus |
| Mid-Premium / Low Volume | High price, moderate volume, mixed retention | Lincoln, Cadillac |
| Budget / Low Volume | Niche economy, variable retention | Saturn, Plymouth |
For market entrants: Competing in the High Volume / Budget quadrant requires scale and brand trust. Premium Niche requires established prestige. The least competitive opening is Mid-Premium — where retention is weaker, volume is low, and incumbents are vulnerable.
5. Depreciation Cost by Manufacturer
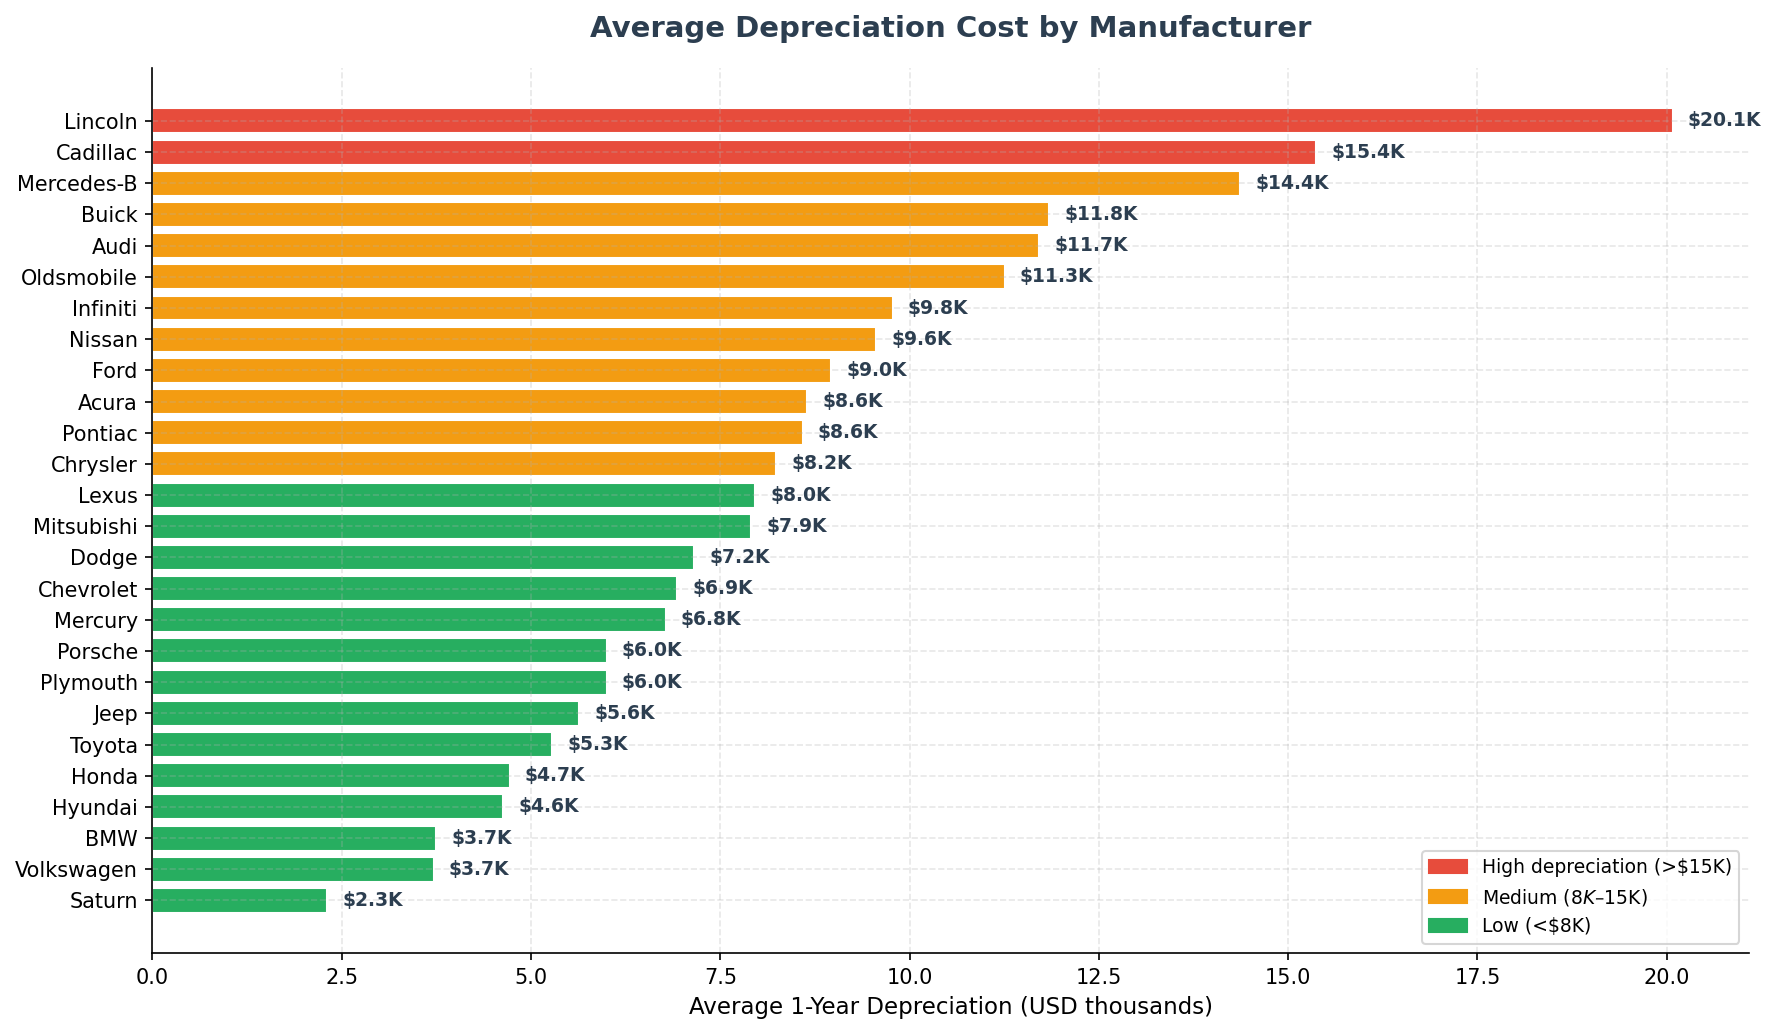
| Tier | Manufacturers | Avg 1-yr Loss |
|---|---|---|
| High (>$15K) | Lincoln, Porsche, Jaguar, Cadillac | $15K–$22K |
| Medium ($8K–$15K) | BMW, Mercedes, Audi, Infiniti | $8K–$14K |
| Low (<$8K) | Saturn, Hyundai, Honda, Toyota | $2K–$6K |
Note: Porsche appears in "high depreciation cost" because its cars are expensive — but its retention rate is 91.7%. Context matters: a $41K car losing $3K is very different from a $25K car losing the same amount.
Strategic Recommendations
For Individual Buyers
- Best value: Honda Accord, Toyota Camry, Jeep Wrangler
- Avoid if resale matters: Lincoln, Buick, Ford Explorer — lose 40–50% in year one
For Fleet & Leasing Companies
- Prioritize: Toyota, Honda, BMW — lowest total cost of ownership
- Avoid: Domestic luxury (Lincoln, Cadillac) — steep depreciation destroys fleet ROI
For Market Entrants
- Volume strategy: $15K–$25K range with reliability focus — retention is the differentiator
- Niche strategy: $30K–$50K premium segment — requires strong brand identity
Project Files
| File | Description |
|---|---|
Car_sales_row_data.csv | Raw dataset |
analysis.py | Python analysis — generates all 5 charts |
Car_sales_analysis.xlsx | Excel workbook with full analysis |
charts/ | All generated chart images |
How to Run
pip install matplotlib numpy pandas
python3 analysis.py
Charts are saved to the charts/ directory.
Tech Stack
Python
Pandas
Matplotlib
NumPy
Excel